Who is this course for? Anybody who is getting started analysing data or building reports with Power BI.
Learning Objectives: Attendees will have a broad understanding of how to explore analyse and visualise data using Power BI and will be comfortable using Power BI Desktop to build reports and dashboards.
Pre-requisites: None
Course Content:
This is a very practical hands-on course. Attendees will build Power BI visualisations, reports of increasing power and sophistication as the course progresses. Most time will be spent in lab exercises – these will use data from public datasets. In some of these exercises, attendees may work in breakout teams of about 4 people. Quizzes at the start of the day will reinforce the lessons learned in the exercises on the previous day. The course covers the following topics.
- Import data from text/CSV files, spreadsheets and databases
- Clean and transform data – replace or remove bad values, filter the rows, group, summarise, pivot and unpivot data, calculate results
- Calculate useful quantities e.g. sums, averages, cumulative values
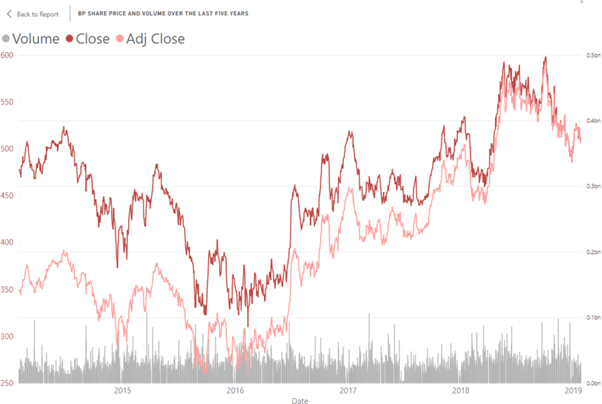
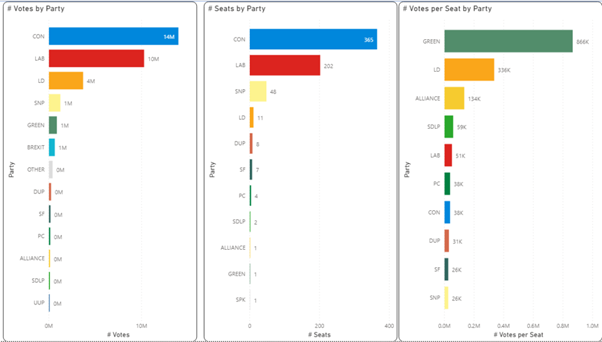
- Build helpful and insightful visuals such as bar charts, line charts, scatter plots, matrix and table visuals, and maps
- Use interactions between visuals (as a filter, highlight) to good effect
- Explore and explain data: drill to detail, show data, add basic analytics (averages, trends, clusters, reference lines
- Filter data with slicers and the filter pane
- Tell stories with data; use bookmarks, spotlight, create drill-though pages
- Improve and polish reports: add text, images and other non-data elements to enhance the report; apply conditional formatting e.g. data bars; configure titles, axes, colours, labels; design for a phone / mobile device
- Publish content to the Power BI Service
Below are some images from the lab exercises on the course.