Who is this course for? Anybody who wants to create geospatial maps with Power BI or who needs to analyse geographic data.
Learning Objectives: Attendees will be able to use Power BI to build circle and choropleth maps using the Bing, Shape, Azure and Mapbox visuals. They will be able to prepare geographic data using free tools such as QGIS and mapshaper. UK attendees will learn how to source UK geographic data from public sources.
Pre-requisites: Basic familiarity with Power BI Desktop – for example by attending the ‘Introduction to Power BI’ course.
Course Content:
This course covers building geospatial maps in Power BI and how to work with location / place data. During the course we will build several choropleth (also known as shape or area) maps and bubble maps (also known as point or circle maps).
We will practice using three of the map visuals in Power BI; the standard (Bing) Map, the Shape Map, and the Mapbox visual. We will learn how to combine map with other visuals to provide a really stunning dashboard – for example using custom tooltips and drill through to get the detail of a place on the map.
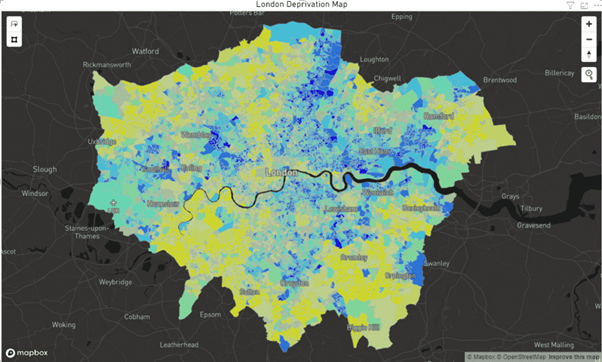
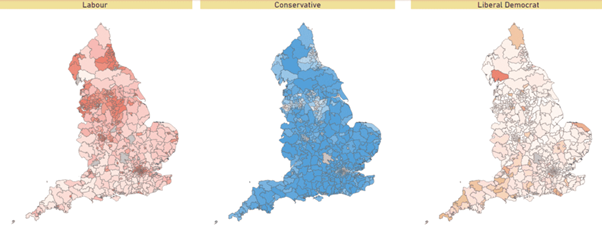
We will learn how to generate shapes for our choropleth maps using public shape files, and tools such as QGIS and mapshaper. In the lab exercises, we create maps of socio-economic conditions in London, health in the UK and worldwide, UK election results and transport maps.
Below are some images from the lab exercises on the course.